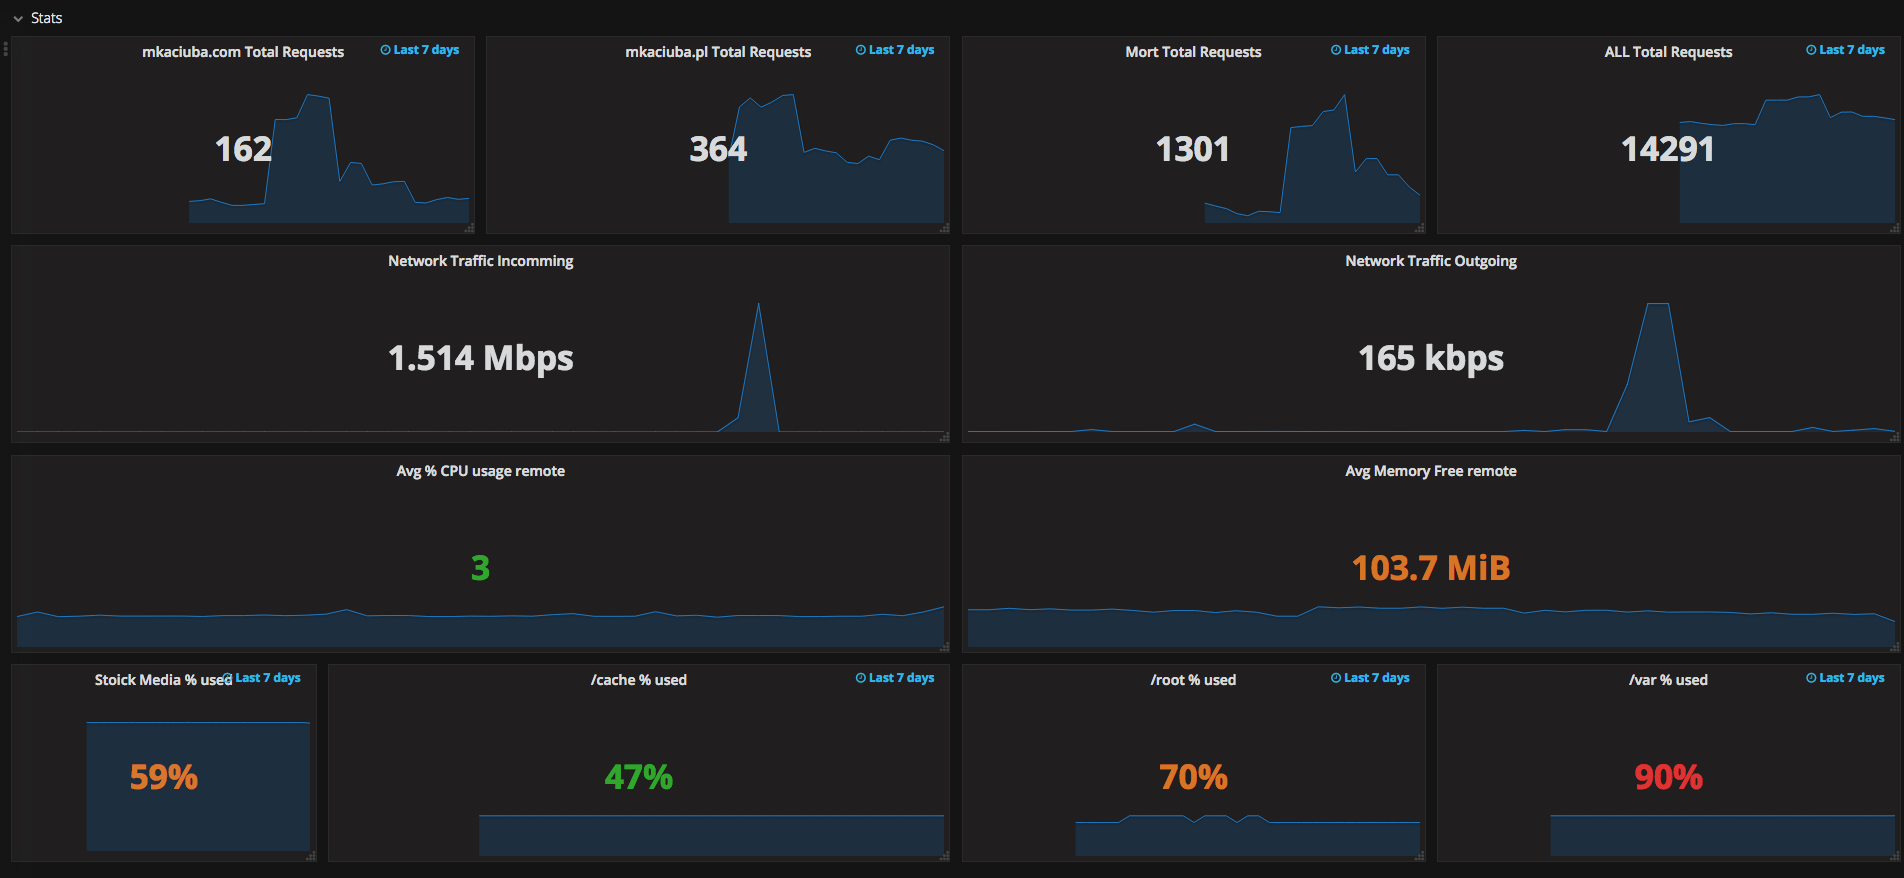
Using Prometheus instead of Graphite
Some time ago for monitoring of my system, I was using graphite. But I had to reinstall my monitoring machine and there was an occasion to test something new. So I tried Prometheus. In this post, I will compare what differences I have noticed between Prometheus and Graphite
Some brief history of Prometheus
Prometheus is a scalable monitoring system that intends to be monitoring for a cloud environment (containers). It was originally developed by SoundCloud and released to Open Source about 2015.
Gathering metric
We can have two model of gathering metrics:
the push model - there is the single point where are metric are going. And metric provider is responsible for sending metrics.
the pull model - monitoring system has to know where it has to query for metrics and its job is to get metrics by using, for example, HTTP query.
First main difference between this monitoring system and graphite is that Prometheus changes model of getting metrics from push to pull. It is not like graphite waiting for metrics but it actively scrapple of know metrics providers. More insight why Prometheus engineers choose such way you can find here
Metric tree
Another difference for me was that in Prometheus you don’t create a metric tree like in graphite.
For example in graphite you can have:
servers.aria.cpu.total.usage_percentage
servers.ciri.cpu.total.usage_percentage
in Prometheus, you can have the label like this
node_cpu where you can have values
- server
- type
It can be more flat than in Graphite
The second example is more flexible you can add more dimensions without changing the path to metric.
Querying
Next thing that Prometheus does in another way is querying language. Graphite uses functions and metric series for example
Average of CPU will be
aggregate(servers.{aria,ciri}.cpu.total.usage_percentage, “average”)
In Prometheus example without metric usage_perecentage. (servers aria and ciri have 4 CPU)
avg(100 - node_cpu{cpu=“total”, mode=“idle”,server=~"(ciri|aria)"}/400*100)
In query you can use some basic mathematical function
More details about querying in Prometheus you can find https://prometheus.io/docs/prometheus/latest/querying/basics/
Alerting
For the end of comparison, Prometheus has a feature that Graphite doesn’t have - Alerts manager it is a separate application that is responsible for informing about alarms. More info: https://prometheus.io/docs/alerting/alertmanager/
Conclusion
This was a very basic comparison of some interesting features for me. More in-depth comparison you can find here I don’t say that one of this software is better from another, As always it all depends on the use case.
Bonus
My Prometheus stack is running in Docker containers. Docker compose file for it is available on my GitHub.
