Homelab 2022 Part 2
In previous post I have described hardware and network setup. Today I will talk about software that I have installed on my cluster
A repository with the configuration described in this post can be found here
- Storage
- Monitoring and logs
- CD - argocd
- Ingress
- Secrets management - vault
- Access from the Internet to apps
- What next?
Storage
In my case for storage I’m using Synology DS920+ NAS server. It is enough for me. There is a project which can provision PVC storage on top of NAS. My configuration below
# helmfile
  - name: nfs-nas
    namespace: nfs-provisioner
    chart: ./charts/nfs-subdir-external-provisioner
    values:
      - values/nfs-nas.yaml
Configuration for storage
# nfs-nas.yaml
nfs:
  server: 10.39.38.109
  path: /volume2/data

# storage class config
storageClass:
  create: true
  provisionerName: nas
  defaultClass: false
  name: nas
  allowVolumeExpansion: true
  reclaimPolicy: Delete
  archiveOnDelete: true
  accessModes: ReadWriteMany
Monitoring and logs
Without proper monitoring, you can’t know if apps are working correctly
Metrics
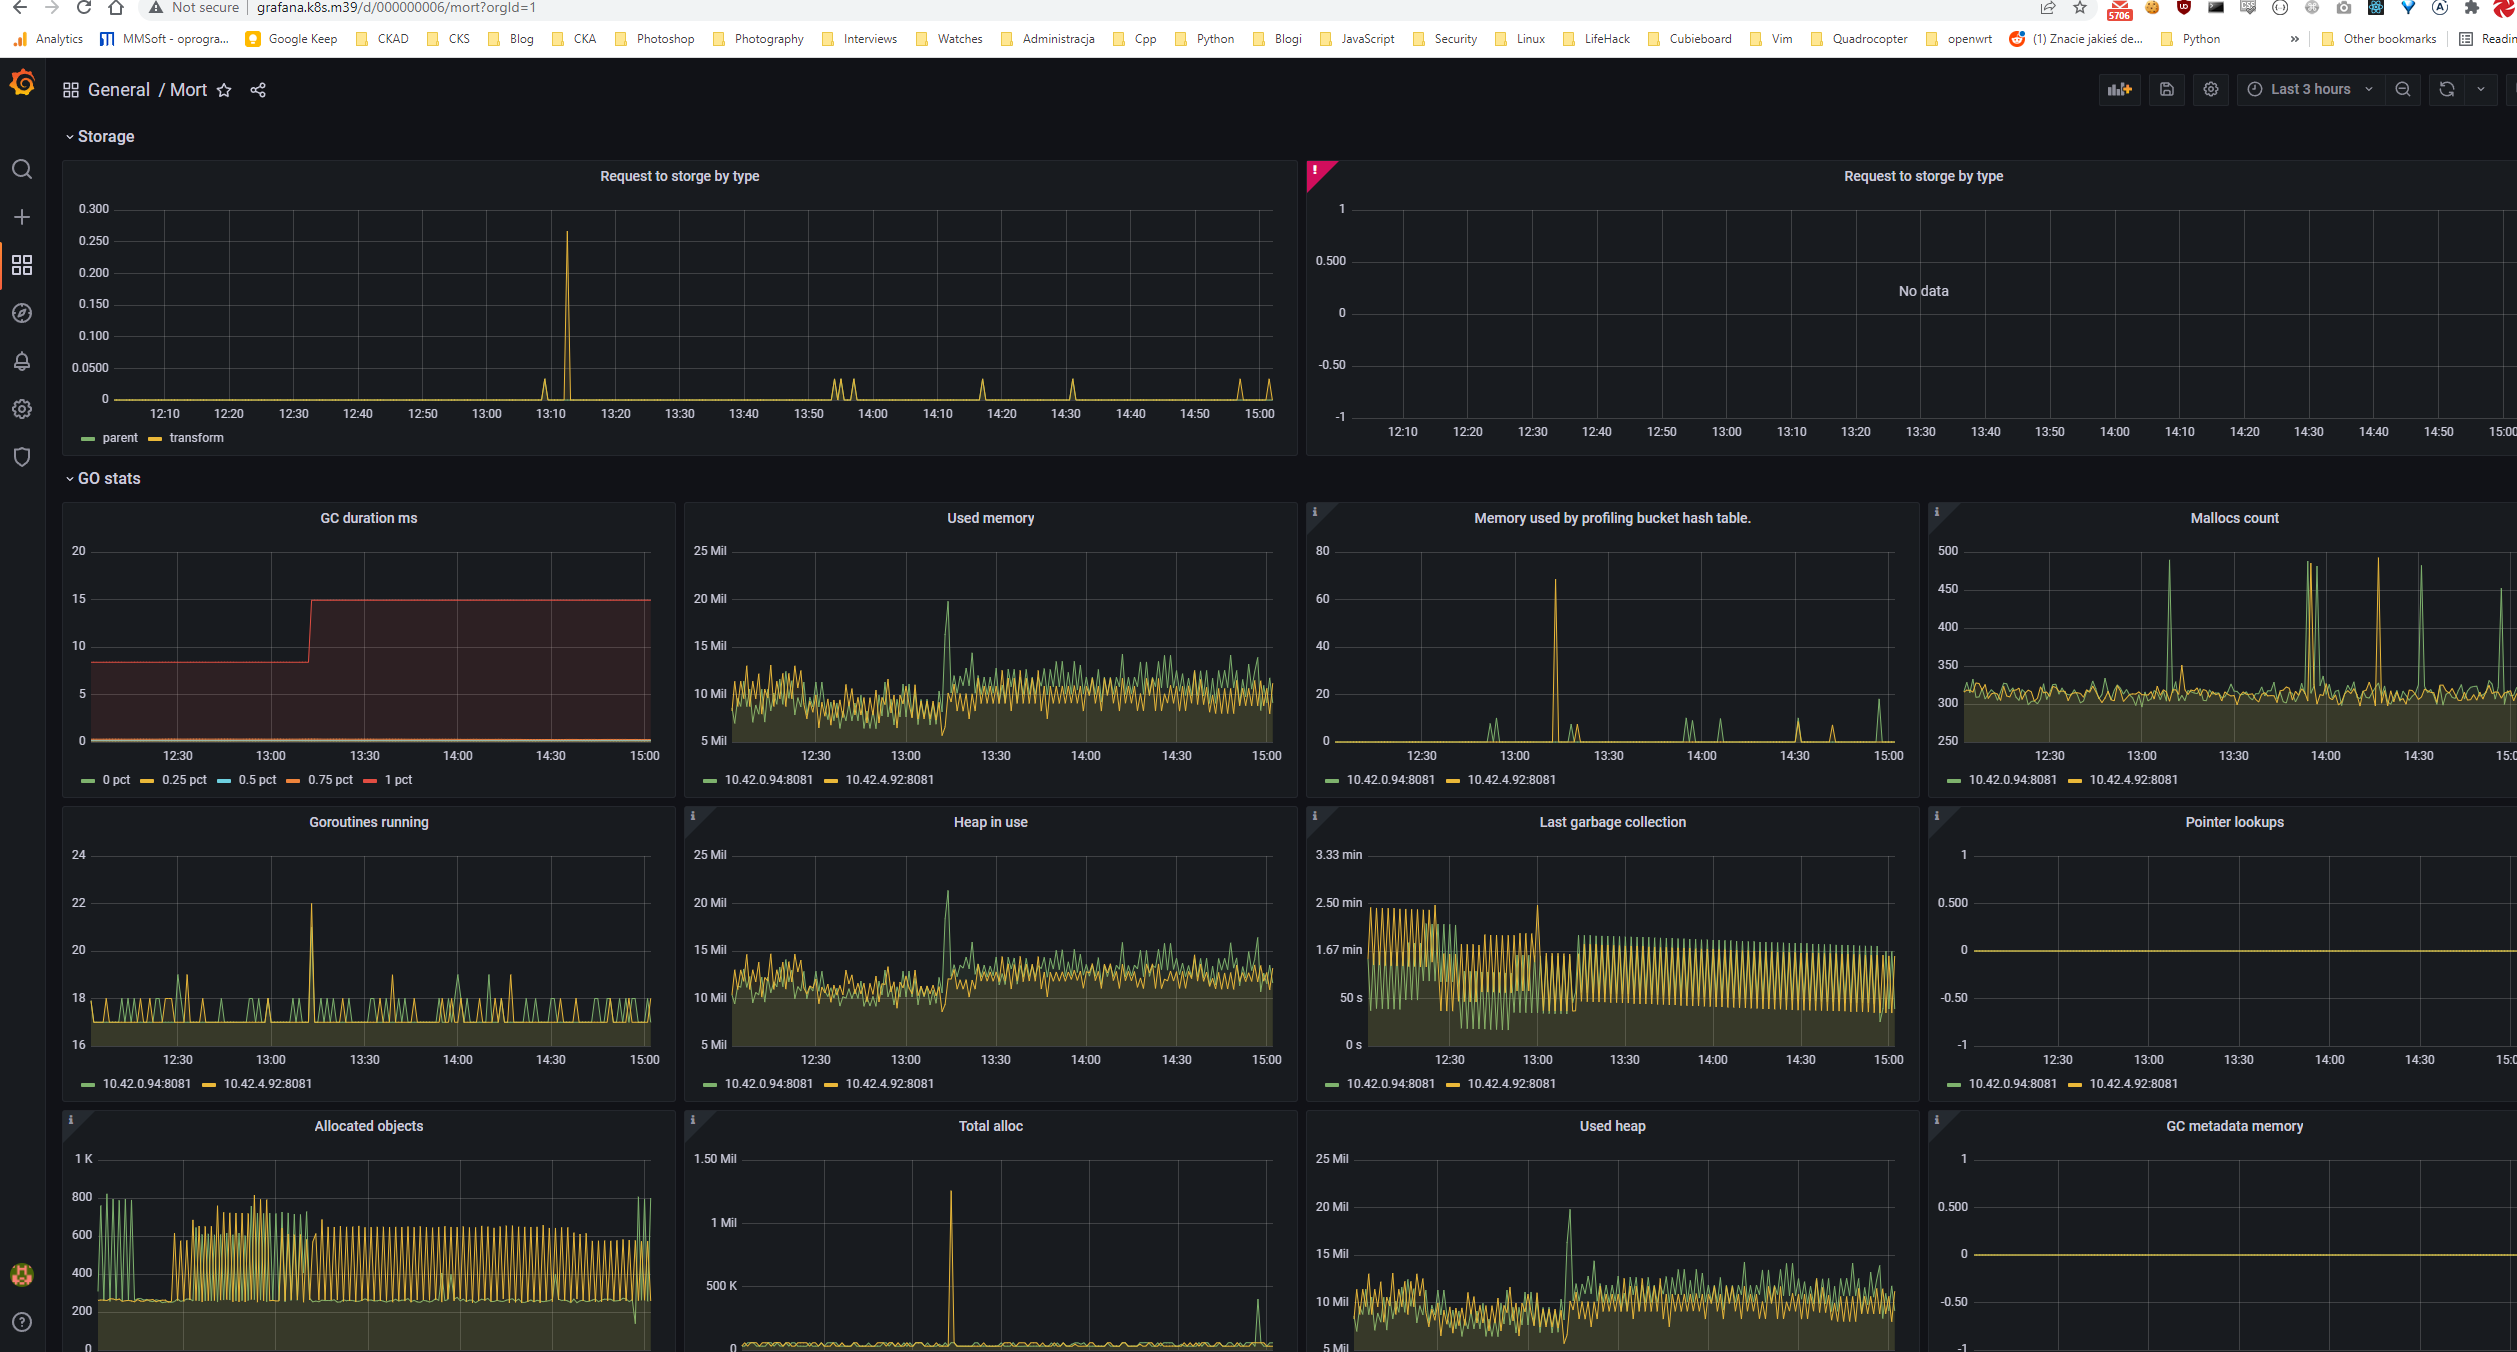
For monitoring I’ve decided to use prometheus-operator It is a well-known monitoring solution for a Kubernetes cluster so I don’t think that I need to describe it more here. My whole configuration can be found here
|
|---|
| Grafana dashboard |
I always have one issue with prometheus operator - I always need to add a label
# https://github.com/aldor007/homelab/blob/c496358ca5ea22c8662ae971bf2f903096d19161/helmfile/values/prometheus-operator.yaml#L1794

      serviceMonitorSelector:
        matchLabels:
          monitoring: prometheus
      serviceMonitorNamespaceSelector:
        matchLabels:
          monitoring: prometheus
Each namespace in which there is a ServiceMonitor has to have monitoring: prometheus label
To make my life easier I’ve written a script which is adding this label
# https://github.com/aldor007/homelab/blob/master/helmfile/scripts/patch-ns-monitoring.sh
NS_LIST=$(kubectl get ns |  awk "{ print \$1 }" | grep -iv name | grep -v kube )

for ns in ${NS_LIST}; do
    kubectl get ns ${ns} -o yaml | grep labels
    if [[ "$?" == "1" ]]; then
        kubectl patch ns ${ns} --type=json -p='[{"op": "add", "path": "/metadata/labels", "value": {} }]'
    fi
    kubectl get ns ${ns} -o yaml | grep labels -A 10 | grep "monitoring: promethes" >/dev/null || kubectl patch ns ${ns} --type=json -p='[{"op": "add", "path": "/metadata/labels/monitoring", "value": "prometheus" }]'
done
And used it in helmfile presync hook
# https://github.com/aldor007/homelab/blob/master/helmfile/helmfile.yaml#L68

    - events: ["presync"]
      command: "/bin/sh"
      args: ["-c", "./scripts/patch-ns-monitoring.sh"]
Logs
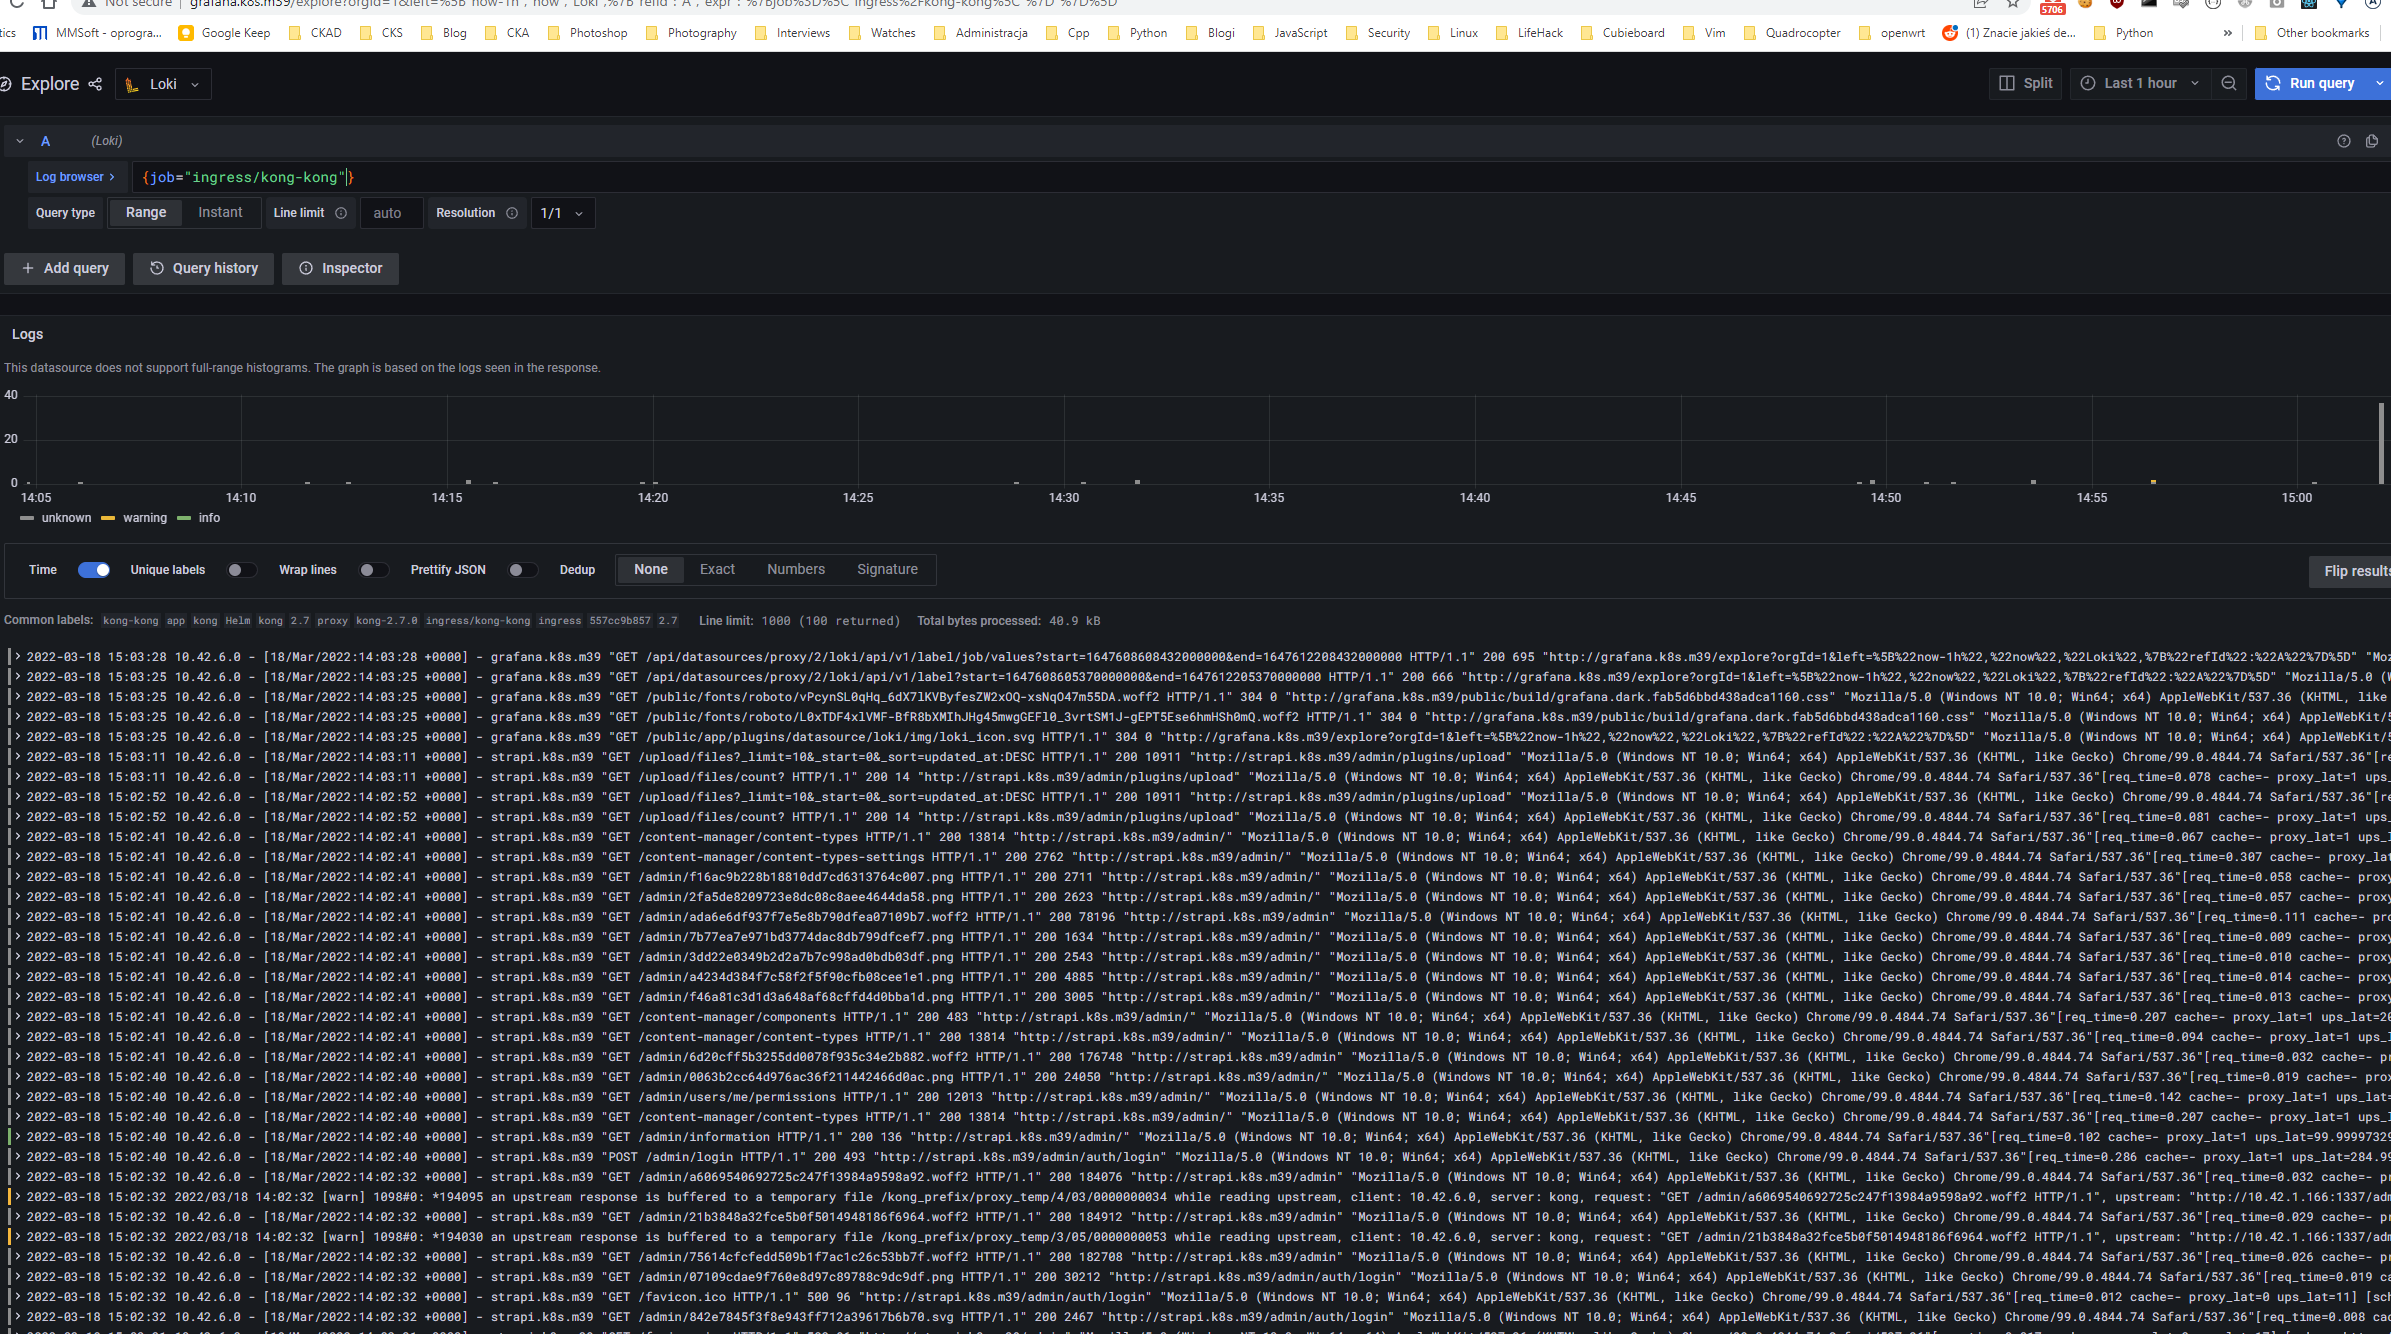
For centralized logging solution I’m using Loki. It works very well with Grafana stack. As I don’t have big traffic it is good enough for me. Configuration is here. There is one additional feature “added” by me - extra container for proxying gRPC requests as greebo can use Loki as backend.
|
|---|
| Loki logs |
CD - argocd
In a cloud native environment ease of deployment is a very important factor. In my commercial experience I have used tools such as Jenkins and Spinnaker but IMO the greatest one that can be used for deploying to k8s is argocd
How to setup argocd?
Example based on my homelab
Install argocd server from official helm chart
# https://github.com/aldor007/homelab/tree/master/helmfile/charts/argocd-m39
# https://github.com/aldor007/homelab/blob/c496358ca5ea22c8662ae971bf2f903096d19161/helmfile/helmfile.yaml#L125
  - name: argocd
    namespace: argocd
    chart:  ./charts/argocd-m39
    values:
      - values/argocd.yaml.gotmpl
Configure access to the repository
# values/argocd.yaml.gotmpl
# https://github.com/aldor007/homelab/blob/c496358ca5ea22c8662ae971bf2f903096d19161/helmfile/values/argocd.yaml.gotmpl#L523
    config:
      # Argo CD's externally facing base URL (optional). Required when configuring SSO
      url: https://argocd.k8s.m39
      # Argo CD instance label key
      application.instanceLabelKey: argocd.argoproj.io/instance
      repositories: |
        - url: [email protected]:aldor007/homelab.git
          name: github-argo-monorepo
          sshPrivateKeySecret: # ssh key used for access can be also HTTP token
            name: argocd-github-sshkey
            key: sshPrivateKey
Add argo apps
Example below
apiVersion: argoproj.io/v1alpha1
kind: Application
metadata:
  name: mkaciuba
  namespace: argocd # argo namespace
spec:
  project: default
  source:
    repoURL: '[email protected]:aldor007/homelab.git'
    targetRevision: HEAD
    path: argo-apps.mkaciuba
  destination:
    server: https://kubernetes.default.svc
    namespace: mkaciuba
  syncPolicy:
    automated:
      prune:  false # Specifies if resources should be pruned during auto-syncing ( false by default ).
      selfHeal: true
      allowEmpty: false
    retry:
      limit: 5 # number of failed sync attempt retries; unlimited number of attempts if less than 0
      backoff:
        duration: 5s # the amount to back off. Default unit is seconds, but could also be a duration (e.g. "2m", "1h")
        factor: 2 # a factor to multiply the base duration after each failed retry
        maxDuration: 3m # the maximum amount of time allowed for the backoff strategy
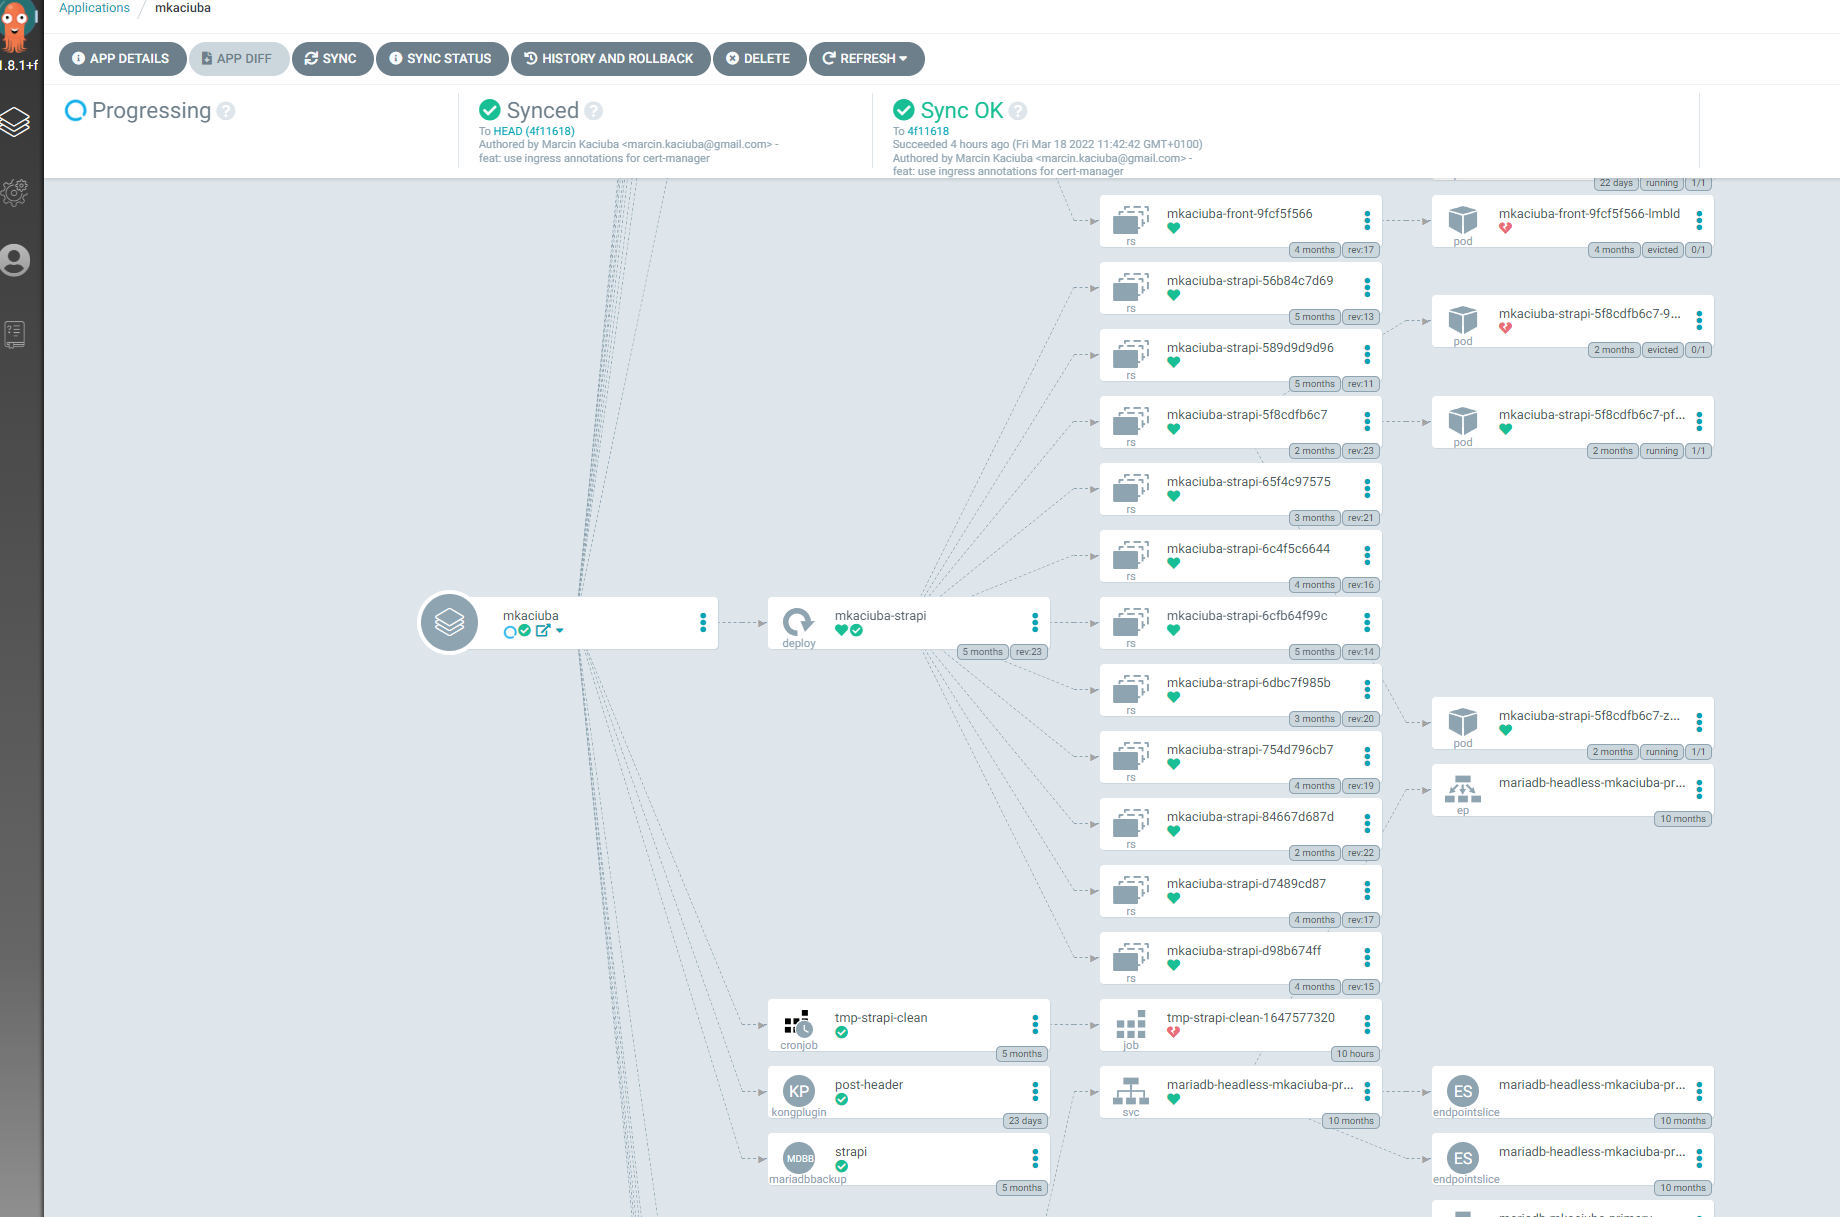
And that it, your application is ready to be deployed by argo
|
|---|
| Argocd dashboard for mkaciuba.pl app |
Ingress
At beginning of my homelab as ingress, I have used traefik (it is installed by default by k3s) but after some time I concluded that it is not enough for my use case. I had an issue with caching of graphql response from strapi. I couldn’t modify response headers in strapi, so I need to do it on proxy/ingress level. I’ve tried to find a solution how to do it in traefik but without luck. I’ve come up with another solution - use kong. In kong it is very easy to add lua script to given ingress. Below are a few lines of yaml that solved the issue
apiVersion: configuration.konghq.com/v1
kind: KongPlugin
metadata:
  name: post-header
  namespace: {{ .Release.Namespace }}
config:
  header_filter:
    -  |-
      --- if there is no cache-control header add no-cache
      if kong.response.get_header("cache-control") == nil then
        kong.response.set_header("cache-control", "no-cache")
      end
plugin: post-function
Kong agility is something that is required by me (writing plugins in lua is fast)
Next feature recently I have enabled is Kong correlation plugin (adding request id header), something not complicated but very powerful
apiVersion: configuration.konghq.com/v1
kind: KongClusterPlugin
metadata:
  name: request-id
  annotations:
    kubernetes.io/ingress.class: kong
  labels:
    global: "true"   # optional, if set, then the plugin will be executed
                     # for every request that Kong proxies
                     # please note the quotes around true
config:
  header_name: x-request-id
  echo_downstream: true
plugin: correlation-id
Distributed tracing here I come! :)
Secrets management - vault
Most of my projects are open source, but still I need to use some kind of tool to store my credentials for S3, etc I do not store them in git, for secrets store I’m using Hashicorp vault, to be precise Banzai version of it bank vault
Installation of bank-vault - operator
# https://github.com/aldor007/homelab/blob/c496358ca5ea22c8662ae971bf2f903096d19161/helmfile/helmfile.yaml#L111
  - name: vault-operator
    namespace: vault
    chart: banzai/vault-operator
    version: 1.9.2
    values:
      - values/vault-operator.yaml
  - name: vault-secrets-webhook
    namespace: vault
    chart: banzai/vault-secrets-webhook
    version: 1.11.2
Installation of a vault
# https://github.com/aldor007/homelab/blob/master/helmfile/charts/vault/templates/vault.yaml
apiVersion: vault.banzaicloud.com/v1alpha1
kind: Vault
metadata:
  name: vault
spec:
  size: 1
  image: vault:1.6.1
  bankVaultsImage: ghcr.io/banzaicloud/bank-vaults:1.9.0
  annotations:
    konghq.com/protocol: https

  serviceAccount: vault
  ingress:
    annotations:
      konghq.com/protocols: https
    # Override the default Ingress specification here
    # This follows the same format as the standard Kubernetes Ingress
    # See: https://kubernetes.io/docs/reference/generated/kubernetes-api/v1.13/#ingressspec-v1beta1-extensions
    spec:
      ingressClassName: kong
      rules:
        - host: vault.k8s.m39
          http:
            paths:
              - path: "/"
                backend:
                  serviceName: vault
                  servicePort: 8200
      tls:
        - hosts:
            - vault.k8s.m39
          secretName: vault-tls
[...]
  externalConfig:
    policies:
      - name: mort
        rules: |
          path "mort/*" {
            capabilities = ["read","list"]
          }
      - name: mkaciuba
        rules: |
          path "mkaciuba/*" {
            capabilities = ["read","list"]
          }
      - name: insti
        rules: |
          path "insti/*" {
            capabilities = ["read","list"]
          }
    auth:
      - type: kubernetes
        roles:
          # Allow every pod in the default namespace to use the secret kv store
          - name: mort
            bound_service_account_names: ["mort", "vault"]
            bound_service_account_namespaces: ["*"]
            policies: ["mort", "default"]
            ttl: 1h
          - name: mkaciuba
            bound_service_account_names: ["mkaciuba", "vault", "purge-api"]
            bound_service_account_namespaces: ["*"]
            policies: ["mkaciuba", "default"]
            ttl: 1h
          - name: insti
            bound_service_account_names: ["insti", "vault"]
            bound_service_account_namespaces: ["*"]
            policies: ["insti", "default"]
            ttl: 1h

    secrets:
      - path: mort
        type: kv
        description: General secrets.
        options:
          version: 2
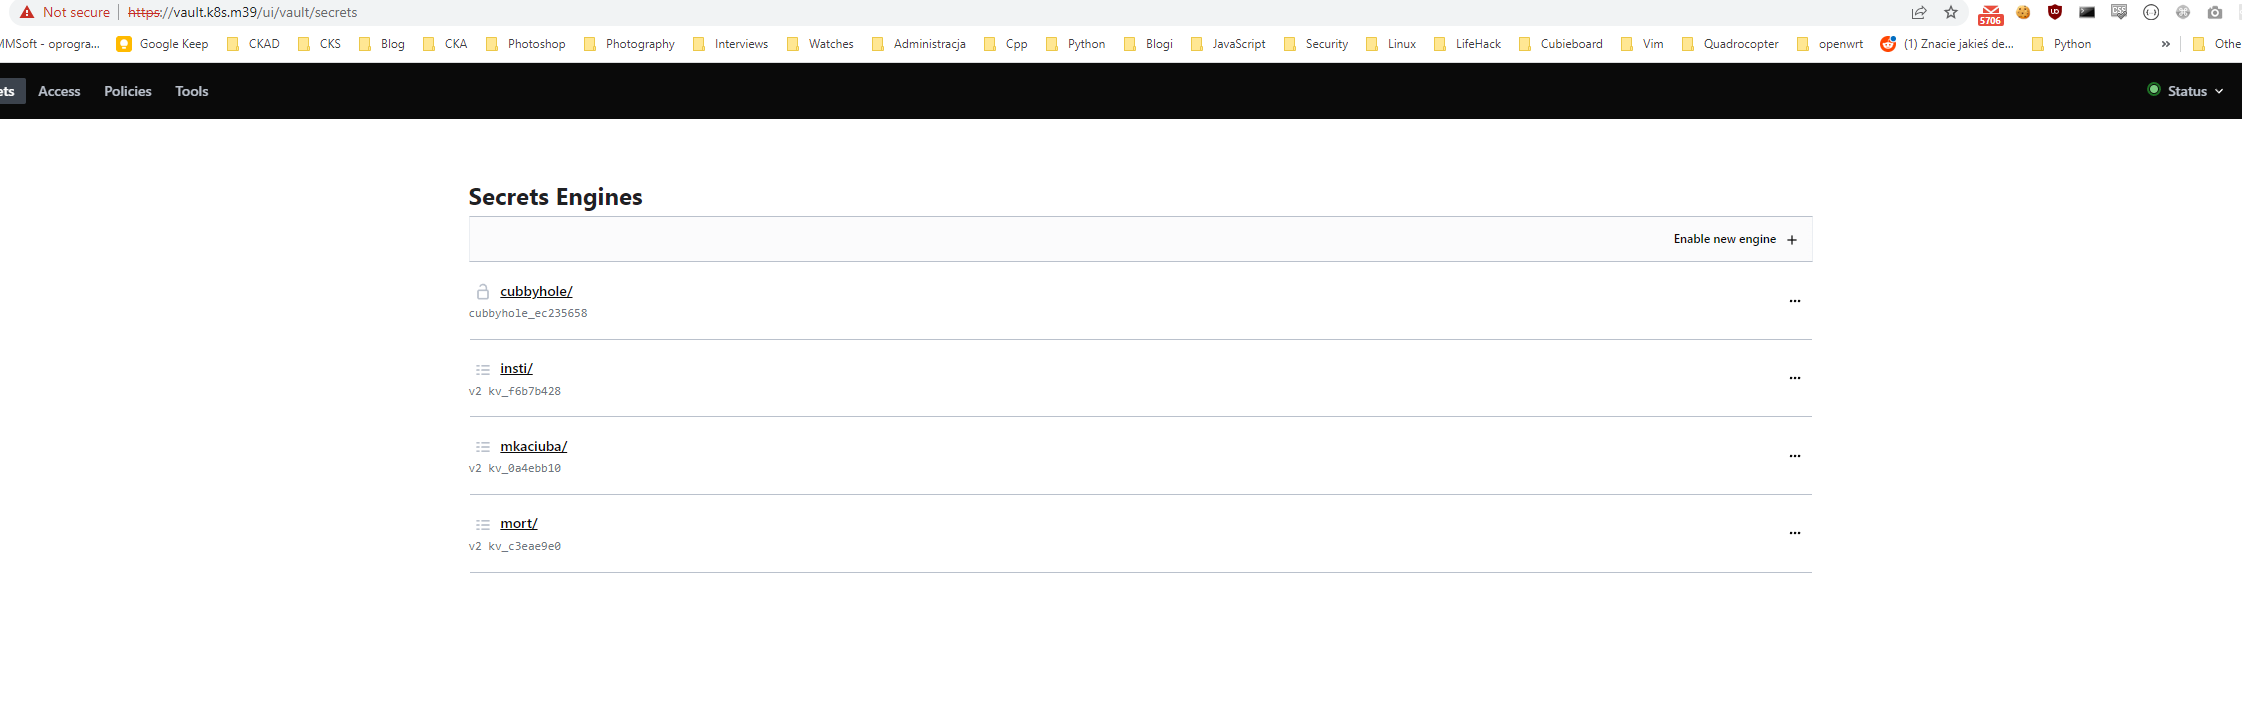
Everything to configure the vault is done by Kubernetes CR. The only manual process is adding secrets in vault ui
|
|---|
| vault secrets |
Accessing secrets from the vault
To access secrets defined in the vault you need to add annotations for pod like below
  vault.security.banzaicloud.io/vault-addr: https://vault.vault.svc.cluster.local:8200
  vault.security.banzaicloud.io/vault-tls-secret: "vault-tls"
  vault.security.banzaicloud.io/vault-path: "kubernetes"
  vault.security.banzaicloud.io/vault-role: "mort"
The retrieval process looks like below. You can have env variables with vault prefix after which there is a path to a secret
secrets:
  enabled: true
  env:
    MORT_ASSETS_ACCESS_KEY: "vault:mort/data/buckets#assets.accessKey"
    MORT_ASSETS_SECRET_ACCESS_KEY: "vault:mort/data/buckets#assets.secretAccessKey"
Access from the Internet to apps
There is improvement in this factor from my previous post. Now instead of using OpenVPN, I’m using cloudflare tunnel.
First of all you need to generate Cloudflare credentials using cloudflared or terraform Next step is to deploy cloudflared into the cluster - chart
Example:
# helmfile
  - name: cloudflared
    namespace: cloudflare
    chart:  ./charts/cloudflared
    version: 0.3.3
    values:
      - values/cloudflared.yaml
# values.yaml
credentials:
  existingSecret: cloudflared-credentials
config:
  tunnel: homelab
  ingress:
    - hostname: '*.mkaciuba.com'
      service: http://kong-kong-proxy.ingress
      originRequest:
        noTLSVerify: true
    - hostname: '*.mkaciuba.pl'
      service: http://kong-kong-proxy.ingress
      originRequest:
        noTLSVerify: true
    - service: http_status:404

podMonitor:
  enabled: true
  metricsEndpoints:
    - port: http
What next?
- backup of a vault
- homepage for homelab - for example https://github.com/bastienwirtz/homer